This is one of the photos used by astronomers Von Del Chamberlain and David J. Krause to triangulate the trajectory of a large fireball with a smoke trail that passed near Detroit, Michigan and Windsor, Ontario, at about 4:43-4:44 p.m., December 9, 1965, The results were written up in the Journal of the Royal Astronomical Society of Canada(JRASC) in 1967.
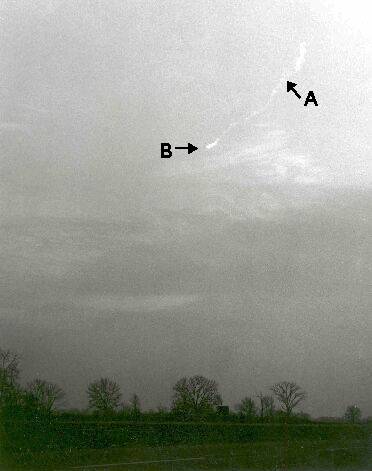
The photo was taken near Pontiac, Michigan, about 20 miles north of downtown Detroit, and shows the smoke trail after the fireball disappeared following an explosion. Point B at the end of the trail was thought to be the puff of smoke created by the final explosion. Supposedly this photo was taken within about a minute of the end of the event. Point A is a kink in the trail also visible in another photo taken about 8 miles southwest in Orchard Lake, Michigan. These two points were what was used for triangulating a trajectory.
High resolution scans of three smoke trail photos from JRASC article can be found here.
This is a working diagram of the triangulation that I lifted directly off the above graphic.
This fireball was also associated with something that came down a few minutes later in Kecksburg, Pennsylvania, about 220 miles distant. Note that the straight-line direction to Kecksburg (see map below) is nearly at right angles to what the JRASC article claimed was the true fireball direction. If that was the case, then obviously the fireball couldn't have anything to do with Kecksburg. It would be just an amazing coincidence.
But just how reliable and accurate was the triangulated trajectory in the JRASC article?
An Analysis of the "Kecksburg UFO" Fireball Trajectory and Possible Error
Skeptics of the 1965 Kecksburg crash love to cite a 1967 astronomical journal article as "proof" that there was no Kecksburg object. But analysis shows numerous serious faults in the paper, including an impossible result of zero error in determining trajectory, clear manipulation of event duration data to double the speed of the object to meteoroid speeds. The object, by their own data, was probably traveling too slowly to have been a meteor, therefore was likely an artificial object. A cited companion "Part II" to the paper with detailed eyewitness reports was mysteriously never published.
Because of the small triangulation base, the range of possible trajectories increases very rapidly even for very small errors in determining directions of less than ± 0.5°. As seen from the graph, a straight-line trajectory to Kecksburg is still possible with an error of about ± 0.6°.
There are other possibilities as well if one assumes the fireball could have been a controlled spacecraft of some kind and could change trajectories, just as the space shuttle does to some extent during re-entry. E.g., if the Detroit-Windsor trajectory was directly West to East, or azimuth 90°, this could be accommodated with only ± 0.25° error. Perhaps later a turn was made towards Kecksburg (pure speculation).
Descent Angle
This also has important implications for the steepness of the trajectory. The JRASC article has the smoke trail diving toward the ground at a 52° angle relative to the horizontal. The altitude at point A is 20 miles and about 4.5 miles away at B it is about 14 miles.
If the JRASC trajectory were correct, one would expect the smoke trail to be of about even thickness between points A and B, since the fireball would be moving sideways to the camera and maintaining about an equal distance at all times. Instead, the trail near A is noticeably thicker than most of the trail approaching B (except in the "puff" at B where the trail ends). A simple explanation of this would be that the trail near A is much closer to the camera than the trail at B. In other words, the trail would again be steeply slanted away from the camera (the fireball was moving off into the distance) instead of being at nearly right angles, as the JRASC article has it.
However, if the object was moving away instead of sideways, part of the dip in elevation angle for point B is due to the object being further away from the camera. This is illustrated in the graph at the right. Assuming a "Kecksburg-directed" trajectory at an azimuth of about 124°, the object instead descends one-third as much, from about 18 miles down to 16 miles over 9 miles of travel, for an angle of 13° to the horizontal, only one-quarter of the 52° in the JRASC article.
The descent angles for the blue curve assume zero error in determining elevation angles for points A and B. However, if the range of error were as great as that for determining the trajectory's azimuth, then the descent angles would be represented by the red curve. At a "Kecksburg trajectory" under the maximum error assumption, the descent angle could be as low as 7°.
However, this is still too steep to get all the way to Kecksburg, as illustrated in the next graph indicating approximate impact point at the given angle of descent. (Note: This calculation assumes a constant angle of descent, such as for a powered object like an airplane, instead of a curved trajectory caused by gravity, such as for a passive object like a meteor.) On a straight-line Kecksburg trajectory, the object would impact about 70 miles away assuming zero error in finding elevation angles and about 180 miles away assuming maximum error.
However, the graphs also show that for azimuths only a little beyond a straight-line Kecksburg trajectory, somewhere between about 126° and 131° azimuth (depending on elevation angle error), the object would descend at only about 4-5° to the horizontal and would impact at about the 220 mile distance to Kecksburg (assuming the simplistic constant descent).
Thus, if the object was really flying at a sharp angle away from the camera, it could be slowly descending in near level flight instead of being in a steep dive, as in the JRASC article. Furthermore, it could fly all the way to Kecksburg instead of impacting nearby. To accommodate the greater azimuths required in this near-level-flight, distant-impact scenario, the errors in determining triangulation directions would have to be increased to about ± 0.7 degrees (above graph).
Another possibility, if the object had controlled flight, is a straight-Kecksburg trajectory at a steeper angle initially followed by the object leveling out at lower altitudes, just as the Space Shuttle does at times as it comes in for a landing. There are, of course, an infinite number of other possible variable descent scenarios.
Change in smoke trail thickness: implications for trajectory
Another possible indication that the JRASC trajectory could be in error can be seen by examining the smoke trail in the photo above and an enhanced, rotated blowup below.
It is interesting that this result is only a few degrees more than the azimuth found for the shallow descent, distant Kecksburg impact scenario.
In March 1966, researcher Ivan Sanderson compiled newspaper and eyewitness reports to the fireball. Sanderson concluded that the fireball took a more southerly route initially rather than making a "bee-line" for Kecksburg. Somewhere over Ohio it changed course to a more easterly direction towards the region near Kecksburg. (By Sanderson's reckoning, the course change was about 25°.) Sanderson's trajectory findings are thus consistent with the more southerly trajectory results derived here from changes in smoke trail thickness plus the constant slow-descent, distant-impact scenario based on the smoke trail elevation angles and triangulation. These assumptions and results would point to the initial trajectory azimuth being about 140° instead of about 124° for a straight-line Kecksburg trajectory.
In the graphic below, the straightline Kecksburg trajectory at 124° is shown in red from point A of the smoketrail to Kecksburg. (Photo sites 1 & 2 also depicted above Detroit). In addition, a possible more southerly route in green is shown, along the lines proposed by Ivan Sanderson, with an initial azimuth of 135°, and after a 25° turn, an azimuth of 110° towards Kecksburg. Note this trajectory takes it directly over Lorain and Elyria, Ohio (southern shore of Lake Erie) where metal debris was reported raining down and grass fires being started.(Map generated by Topo USA). More on the Elyria debris below, which may have been examined by NASA.
The graph at right shows the expected perspective change in trail thickness as a function of the azimuth or direction of the trajectory. Note the JRASC trajectory at 40° azimuth (or pointing nearly Northeast) has a trail thickness ratio close to 1.0, what would be expected for an object moving sideways to the camera. (If anything, with the JRASC ratio of about .92 between beginning and end thickness, the graph shows the trail should have gotten slightly thicker as the fireball progressed, not thinner.)
However for a trail thickness ratio of 1.5 (as determined by linear regres-sion above),the graph indicates the trajectory as being around 140° (or to the Southeast), assuming the ratio is due to the object moving sharply away from the camera from points A to B ), or due only toperspective and not some other confounding factor, like the fireball "fizzling out".
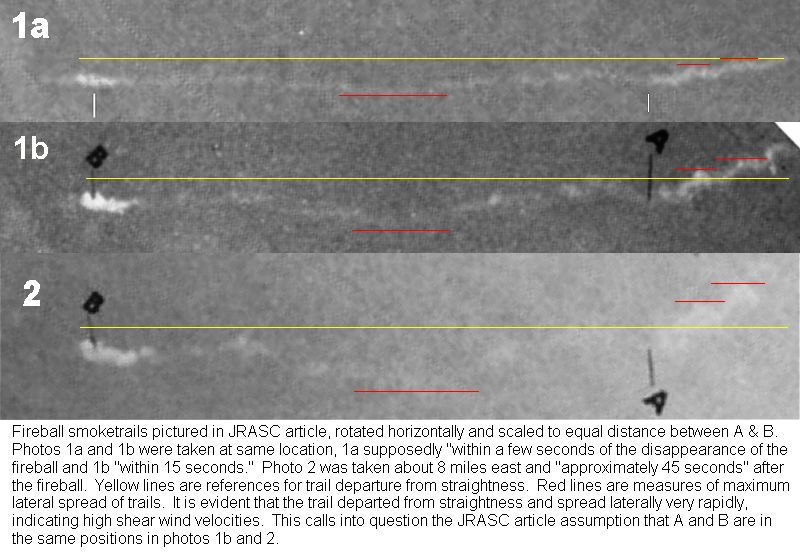
In making the above graphic, the three trails were rotated about 45° to a horizontal position. For comparison purposes, features A & B in all three pictures were made level and scaled to be the same distance apart (although the equi-distance assumption is itself in question.)
Red horizontal lines mark extreme positions of trail drift in features common to all three photos. The photos of the first two trails (1a & 1b) were both taken from the same site, while trail 2 was taken at a separate site about 8 miles northeast (see triangulation details above). According to the JRASC article, photo 1a was taken "within a few seconds" of the end of the fireball, while 1b was taken about 15 seconds afterwards. Photo 2 was supposedly taken about 45 seconds after the fireball.
Interestingly, the separation between the red lines in 1b is about double that of 1a, while the separation in 2 is about triple of 1a. Assuming a constant lateral rate of spread of the trail and that photo 2 was indeed taken at 45 seconds, this would suggest that photos 1a and 1b were more likely taken at about 15 seconds and 30 seconds after the disappearance of the fireball.
By photo 2, the distance between the red marked extremes is already about one sixth of the distance between points A & B. In the JRASC article trajectory, A & B are separated by about 7.4 miles in 3D space. (see calculation below). Thus, even in the JRASC article, the trail has departed from straightness by 1/6 x 4.5 = 0.75 miles in 45 seconds, or at a rate of about 1 mile a minute or 60 miles an hour.
If the trajectory is instead slanted steeply away from the camera, as the analysis above suggests, then the distance between A & B would be much greater and the relative dispersal of the trail proportionately faster. E.g., at a trajectory azimuth of 130°, the distance between A & B is more like 9 miles, or double that of the JRASC value, and the high altitude winds would be dispersing the trail at about 120 miles an hour.
Thus this analysis indicates that there were high-altitude shear winds on the order of 60-120 mph, causing the trail to rapidly disperse and depart from its initial straightness. Even if photos 2 and 1b were taken only 15 seconds apart, this still raises the possibility that points A & B could have shifted relative to one another by one quarter to half a mile.
This diagram illustrates how possible
wind shear could shift the true INITIAL
positions of points A & B in photo 1
to NEW positions A2 & B2 between
when photos 1 & 2 where taken. This
again can result in false triangulation
points A' & B' and a radically different
false trajectory.
Again, real world total error is likely
to be combinations of multiple sources
of error, not just these simplified
illustrated examples.
The triangulation diagram from the JRASC article is shown directly below, noting the location of the two photo sites (1 & 2), and the two triangulation points in the trail (A & B). The authors claimed the triangulation showed the fireball trajectory ran from the Southwest to the Northeast (dark line between points A & B)
(Among a number of problems with the paper, the coordinates of points A & B were reversed, meaning the fireball would have been racing upward rather than downward and in the opposite direction. The mistake was corrected in a later edition of JRASC.)
Possible sources of error in JASC article
That the fireball could assume such a trajectory taking it ultimately to Kecksburg depends on the triangulated JRASC trajectory being seriously wrong. As previously noted, this would involve significant errors in determining directions of their triangulation points. Sources of potential error in the JRASC article are numerous and include tiny errors in reading compass directions in on-site surveys or not locating the exact sites to within inches of where the photos were taken during the same surveys. (For example, one of the photographers, the one quoted by Sky and Telescope, was driving his car when the fireball happened; his photo was taken by the side of the road in the middle of the country--see photo at top. Under these circumstances, it would be extraordinarily difficult to precisely determine where the photo was taken.)
This could throw off the proper scaling of the photos if the position was wrong in the radial direction, resulting in the calculated angular distance between points A and B being either slightly too small or large. In addition, the location being off laterally (or if compass readings were slightly off) would cause systematic error in the directions even if the photo scaling was correct. Another possible source of scaling error would be not taking into account possible camera lens distortion in the photos.
The overall thinning of the trail before the puff at the end is illustrated in the plot of trail thickness as the fireball moved from right to left in the photo (note direction of red arrow). Obviously the thickness is erratic, but taking a linear regression through the scatter of points (red line) shows that on average, the thickness is about 1.5 times greater at the beginning of the trail (right) than at the end (left).
A huge problem with the JRASC article was no included error analysis. Note that photo sites 1 & 2 are relatively close together compared to the distance to the fireball trail (A & B), creating a narrow triangulation base. This diagram shows the possible effect of 1 degree of error in determining the directions of points A & B. As a consequence, the resulting trajectory instead of being well-defined can instead vary over about 150°!A Kecksburg trajectory would fall well within this error range.
As an example of just how uncertain such a fireball trajectory calculation can be, the famous Tagish Lake fireball of 2000 in Canada left a much longer smoke trail about 100 miles in length, was photographed from multiple angles from beginning to end, including an overhead satellite photo (thus a very wide base of triangulation) and left a linear debris field of meteorites on Tagish Lake, by itself defining an approximate trajectory, yet various astronomers (1, 2) who calculated the trajectory gave it an accuracy of no more than ±2.2°-2.4° azimuth angle (and ±1.2° -1.6° horizontal entry angle).
(Math note: "Azimuth" represents the degrees measured from North in a clockwise direction. Thus North is 0°, East is 90°, South 180°, etc.)
In a more recent and even better documented bolide case, the meteor that exploded near Chelyabinsk, Russia, in 2013, was videoed over a wide range of angles from numerous positions, providing much more data for accurate triangulation. In addition, it laid down a long, linear meteorite field, further defining the direction. Even with all this, one analysis still had an overall uncertainty in direction of about 13 degrees in azimuth.
Yet the JRASC article, with far less information to go on, assumes ZERO error, which is unscientific not to mention impossible. There is always measurement error; a key component to determining whether a result is valid or not is estimating the degree of error. (For a rebuttal to a debunker's silly, pseudoscientific claim that there was absolutely zero error and it is up to me to prove there was any, click here.)
The graph immediately below shows a more quantitative analysis of the effects of differing direction errors on final trajectory. This was done using basic high school Algebra and trigonometry (plus an Excel spreadsheet) to determine intersection points of the error lines and the range of angles of possible trajectories that can result.
The Sky and Telescope article
JRASC wasn't the only astronomical journal to publish an article on the fireball. Sky and Telescope magazine published an earlier article in February 1966("Great Lakes fireball"), in which they contradicted the JRASC trajectory conclusion. As the caption of their diagram below reads, "The path of the fireball extended roughly northwest to southeast..." This is exactly the same conclusion reached above based on the analysis of trail thinning.
In addition, they cited the impressions of one of the photographers of the photos used by JRASC (the one who took the photo at the top). According to S&T, "The fireball traveled toward the EAST [emphasis mine]… Although when first seen the fireball APPEARED TO BE FADING [emphasis mine], it ended with a burst of light.” This again is consistent with the photos indeed seeming to show the trail thinning and fading, at least leaving the impression of the object moving away from the photographer in the distance, roughly toward the east, not sideways from southwest to northeast. And in a letter to the USAF only 2 days after the incident, the same photographer similarly said it was moving "to the east" but on an estimated trajectory of 110° azimuth (so more to the ESE than E), even closer to the straight-line trajectory to Kecksburg of about 124°.
Further possible error could be added to the mix if "points" A & B weren't truly fixed in space. The JRASC article also seemed to assume no significant shifts in the smoke trail between photos, and therefore A & B remaining in the same positions. However, the composite image below, showing three trails from the JRASC article, calls this assumption into serious doubt. Were there no significant shifts in the smoke trail, then the trail should remain nearly straight. Instead, it obviously departs very rapidly from straightness, even in the first photo supposedly taken only seconds after the fireball disappeared. In the third photo, taken roughly 45 seconds after the fireball, the trail is already very twisted. This could indicate significant turbulence or high-altitude shear winds causing the trail to depart quickly from straightness. If that was the case, then the locations of points A & B were NOT the same in photos 1 & 2.
This next illustration shows how random measurement error or a systematic photo scaling error can likewise dramatically shift the trajectory. Again, for simplicity, the errors are assumed only from one photo position, in this case #1. Here, small errors are shown to shift directions of "points" A & B laterally outward, creating falsely triangulated "points" A' & B'.
As noted, to simplify illustrations these types of potential error are assumed from one photo point only. But such errors are likely at both photo positions. Thus errors are likely to compound. It was the responsibility of the authors to estimate the degree of such errors since they could potentially have a very significant impact on the outcome, but this was not done.
The diagram at the right illustrates how a simple error in determining the exact photo position could cause a small lateral shift in the directions of fireball trail "points" A & B, creating a false trajectory (A'®B'). For simplicity in illustration, the lateral errors are considered only for photo position 2, with directions for position 1 presumed to be "exact". The real "points" A & B are indicated with solid red and blue starburst symbols, whereas the falsely triangulated ones are open symbols.
As an example of how this could affect the trajectory calculation, the distances from the photographers to the midpoint of the smoke trail is on the order of 45 miles. 1 mile lateral change in position represents about 1.25°. A lateral shift of 0.25-0.50 miles between photos 1a & 2 would thus represent an angular shift between A and B of about 0.3-0.6°; whereas ~1.2° total direction error is all that would be needed to sent the fireball on a possible trajectory headed straight for Kecksburg.
Another indication that there is probably a shift in the positions of "points" A & B can be seen by examination of the size of the puff of smoke at B in the composite above of the smoke trails. It lengthens about 50% in size between photos 1a and 2, or about 3% of the distance between A & B, or about 0.3°.
All that is said in the JRASC article about all this is that they compared 4 photos taken from site 2, covering a span of about 80 seconds (therefore, from about 45 seconds to 125 seconds). The article claims that these four photos "reveal that the total drift of the cloud was minimal, although disintegration of the train is evident."
Ironically, author Chamberlain seemingly contradicted this statement in another paper written a year later ("Meteorites of Michigan"), in which he wrote: "Lasting only 4 seconds, the fireball brightened at one or more points and finally burst and disappeared leaving a trail of 'smoke' along the final portion of its path. Although dissipating considerably in a few minutes, the trail remained visible for about an hour."
Comparison of the three photos above, taken perhaps only 30 seconds apart, likewise reveals that relative drift of the cloud was anything but "minimal." Winds on the order of 60 miles an hour or higher were causing rapid trail distortion and disintegration. The whole premise that triangulation points A & B remained in the same positions between the two used triangulation photos is thus highly questionable.
Other problems with the paper
1. As mentioned briefly before, the triangulated points A & B were reversed in the paper, giving a fireball going in the opposite direction and upward. Although the mistake was ultimately corrected in a later issue and has nothing to do with the accuracy of the intended trajectory, it does point to further sloppiness in the editing and the peer review process (which should have picked up on such a glaring mistake. The review process also didn't seem to insist on even a token error analysis, as should have been done by any normal scientific paper standards with quantitative data.
2. The paper, which was "Part I" of the analysis, mentions a "Part II", which was supposed to be an analysis by two Canadian scientists of 66 detailed eyewitness case reports that were collected. What C/K wrote about this in their Part I was:
"Contact was made with Dr. J. A. V. Douglas of the Geological Survey of Canada, and Mr. Henry Lee of The Royal Astronomical Society of Canada. One of the authors (V.D.C.) spent some time in the area of possible meteor fall, confirming the trajectory and initiating the search for meteorites. Douglas and Lee carried on more extensive investigation of visual sightings, audible phenomena and meteorite search ("The Fireball of December 9, 1965--Part II"). To date no meteorites have been found."
"Part II" should have been the next paper, but for reasons never explained was NEVER published in that issue, any later issue, or some other journal. This isn't so much a problem with the accuracy of Chamberlain and Krause's trajectory analysis, but with the overall handling of the data in this fireball case. Why did the second paper disappear?
(I manually checked the next 2 years of JRASC, but today you can use the Internet tosearch an online JRASC index--still no such paper. You can verify the same Dr. Douglas co-authored alengthy and very detailed JRASC paperin the same issue as C/K (including a real error analysis and discussion of the many uncertainties in determining a trajectory) on another Canadian fireball from April 25, 1966, but absolutely nothing on the Dec. 9, 1965 fireball. Henry Lee published nothing on any fireball in JRASC. A broader search of Google Scholar also turned up no such paper in some other journal.)
3. In trying to estimate the speed of the fireball, the authors did state that a "majority" of these same 66 witnesses estimated a duration of the optical phenomenon of 3 to 4 seconds. In line with this, the Sky & Telescope article mentions over 100 eyewitness reports collected by Chamberlain himself immediately afterward. Chamberlain was quoted by S&T likewise giving a duration of "about 4 seconds" based on this collection of his own witnesses. He reiterated the "4 seconds" duration figure (see full quote above) even a year after his JRASC paper in another writeup ("Meteorites of Michigan"). Despite this, the authors instead took only the estimates of the two photographers of 1 and 4 seconds, made this into an "average" of 2 seconds (why not the true average of 2.5 sec?), which then gave the fireball a "typical" meteor speed (but see item 5 below, where even this forced result may have been further off by 250%!). Their given rationale for this was that, in their opinion, the two photographers were "in the best position to judge." This makes no sense since the two differed in their duration estimates by a factor of four. Further, one of them (1 sec. estimate) was driving in his car on the Interstate, and may well have been unable to see the full course of the visible phenomenon. Surely a few of the other 64 ignored eyewitnesses must have had at least as good or better vantage points and views of the phenomenon. Why weren't they used?
4. Photographer and self-described skeptic Rand McNatt was very critical of their assumption, believing they were force-fitting the "average" duration to give a meteor speed, instead of using the true average duration, which would have given a much lower object speed, below meteor range, but more in line with what would be expected for re-entering satellite or missile debris. McNatt's theory (which he admits there is very little evidence for) was that the fireball was actually created by a faulty/errant re-entering U.S. ICBM armed with nukes, and that's why it was hushed up. The apparent velocity C/K gave the fireball after their highly questionable duration time machinations was about 14.5 km/sec or 32,400 mph. Doubling the duration time to 4 sec. would have halved the speed to 16,200 mph, or indeed more in the range of a re-entering satellite or ICBM missile.
As to how they got their apparent velocity (the speed at which the observer on Earth sees a meteor traveling from their perspective without adjusting for factors like Earth's rotational velocity, the angle of the meteor as it enters the atmosphere, gravitation, and other factors like Earth's orbital velocity), all they say is, "The velocity of the meteorite as it passed through the Earth's atmosphere is uncertain. Relying on the duration estimates Messrs. Wright and Champine [the two photographers], who in the opinion of the writers were best qualified to judge, an apparent velocity of 14.5 km/sec [32,400 mph] was adopted as the value to be used in the orbit calculation."
5. I am unable to understand why they are seeming to guess the number, since the only directly observable "apparent velocity" is between their derived Points A and B (where the fireball was from the observers' point of view on Earth). This is straightforward to calculate: simply the distance between A & B divided by the duration. They state that their Point A was about 32.2 km (20.0 mi) above Earth and explosion point B 22.9 km (14.2 mi) up. The vertical distance is thus about 5.8 mi. Given their ground longitude/latitude coordinates, the horizontal distance was 4.53 mi., in agreement with their given descent angle of 52 deg. When you calculate the total distance between both points, it is only about 7.4 mi. However, 7.4 mi even with 2 seconds duration gives an average speed of 3.7 mi/sec (6 km/sec), or only 13,200 mph, or only about 40% of the speed given in their paper. And at the much more likely 4 second duration, the average apparent velocity would be half that, or 6600 mph 3 km/sec). (Since this is the average speed, the endpoint speed would be even less than this. E.g., if the speed was 10,000 mph at point A and the object had a constant high deceleration, it would be traveling 3200 mph at point B in order to average 6600 mph.)
My own proposed trajectory at right angles to C/K's would have a longer path with the same durations, resulting in higher calculated speeds. E.g., depending on actual trajectory, I get a path length of about 9-11 miles between points A & B. Using the upper value of 11 miles, that's still only 2.75 mi/sec or 4.4 km/sec (~10,000 mph) for 4 second duration and 5.5 mi/sec (~20,000 mph) for a 2 second duration. The 10,000 mph figure from 4 sec. duration is the much more likely of the two, and the type of speed that might be expected from an object entering from orbit, like the Space Shuttle, and using something like air friction to slow down in a controlled manner on a much shallower trajectory over a much longer period of time. At the lower estimate of increased distance (9 miles), the average speed would be more like 2.25 mi/sec (3.6 km/s) or 8100 mph.
This higher calculated apparent velocity of 10,000 mph on a different trajectory is still only 30% of the author's number. And using their shorter path length with a calculated velocity of 6600 mph is only 20% of their value. Where did they get it? Since their points A & B are lower down in the atmosphere, perhaps what they mean by "apparent velocity" is not the actual observed velocity from the photos, but what might have been observed before the object was slowed by the atmosphere. But there is considerable uncertainty with regards to a natural object like a meteor and presupposes that it had to be a natural object instead of an artificial object with a more controlled descent. At the very least, the authors should have been much more explicit about how they arrived at their much higher figure, such as a theoretical equation about how meteors might slow down once they hit the atmosphere.
6. However they came up with their meteoroid speed, it is pretty clear that Chamberlain and Krause deliberately ignored the majority of eyewitness duration estimates in order to force-fit a much higher "meteor" speed rather than the lower one, more consistent with something else entering the atmosphere from Earth orbit (not the depths of space), which would almost certainly be artificial in origin, whatever it was.
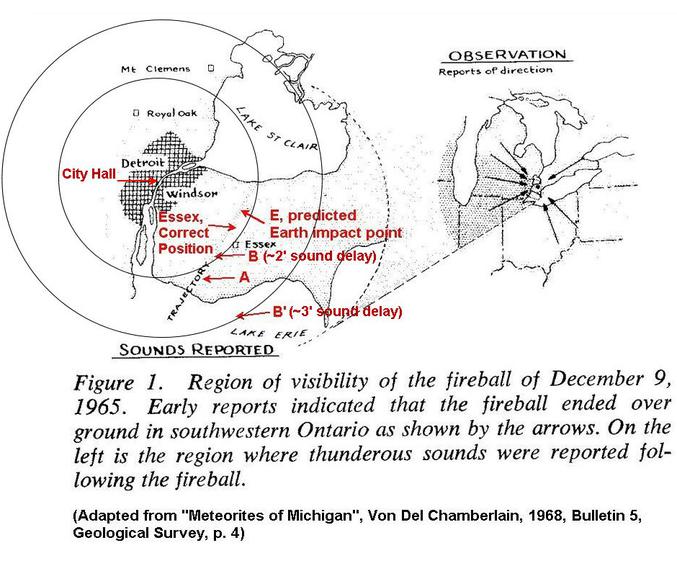
7. Finally, Chamberlain seriously contradicted himself in his later 1968 writeup ("Meteorites of Michigan"), concerning the position of where the explosion boom likely occurred compared to his alleged trajectory in the JRASC paper. In JRASC, they placed the explosion point "B" about 14 miles up and about 19-20 miles ground distance from "the heart of Detroit", to use Chamberlain's words, what I'm presuming to be Detroit's downtown or "midtown" area. (I'm using Detroit City Hall at 19 mi as the closest position of central Detroit from their explosion point, marked on Chamberlain's map below. This is also in the center of the shaded area of Detroit/Windsor on the map, which I am presuming are the areas in the immediate "heart of Detroit" where the explosion was heard.) The total slant distance to City Hall (use the Pythagorean theorem) is about 23 miles. However, Chamberlain stated in his "MoM" paper, "The loudest boom marking the end-point of the fireball was produced not more than 35 miles southeast of the heart of Detroit." This estimate may have been based on the time it took for the boom to arrive in Detroit, according to Chamberlain: "Explosive retorts were heard in the Detroit area three to five minutes after the fireball disappeared." Then adding, "This information indicated the meteorite must have fallen north of Lake Erie in Ontario." However, as we'll see in a moment, if the time delay estimates were accurate, the latter statement was NOT true because the sound delay should have been a minute shorter.
At the speed of sound, with an average of about 11-12 miles/min through various layers of the atmosphere, it would indeed take about 3 min. to reach the closest portions of Detroit at about 35 miles distance. But their explosion point "B" was only about 23-24 miles away from "the heart of Detroit", or only about 2 min. travel time. Thus if point "B" was correct, the expected "boom time" to Detroit should have been about 2 min., not 3 min. I have also added a circle to the graphic, with point B on it, centered on Detroit City Hall showing all points where an explosion at the ground distance and altitude of the C/K paper would take about 2 min travel time to central Detroit.
In addition, Chamberlain's graphic also shows the furthest reaches of where sound was reported. On the diagram, 2 towns are marked on the outskirts of Detroit: Royal Oaks, about 12 mi. NW of downtown Detroit, and Mt. Clemens, about 22 mi. to the NNE. I am presuming they are on the map because sound was reported there. Royal Oaks is about 31-32 ground miles from Point B, for a total slant distance of about 35 mi.; Mt Clemens is about 36 ground miles for a slant distance of about 39 mi., or about a 3.3 min. delay at most. Neither of these can account for a 5 min. sound delay, where the distance would have to be at least 55+ miles. It is not clear that Chamberlain even realizes that his numbers for the sound time delay and his trajectory point B are potentially in serious conflict with one another.
This is true unless the aural witnesses on average were very badly in error as to their estimates of delay. But Chamberlain provides no data to help us judge how much in agreement witnesses may have been. Remember, there was supposed to be a Part II to the JRASC article providing the detailed witness data, which mysteriously never got published. Judgments of short time delays, such as a few minutes, are known not to be terribly accurate overall, so a margin of error of +/- 1 minute is probably reasonable, which would just accommodate Chamberlain's data.
Perhaps another mitigating factor was an earlier statement by Chamberlain in the Feb. 1966 issue of Sky and Telescope where he gave the sound delays as 2.5 to 5 minutes. However, this statement would have been made very soon after the event and perhaps before he could analyze his data in detail. I would think his later statement of 3 to 5 minutes would better reflect what the data really showed, but since the raw data was never published, we just don't know. In any case, the sound delays provided are not strongly supportive of the trajectory he proposed.
In contrast, on a SE or "Kecksberg" trajectory, with a much shallower downward trajectory, about one quarter of the JRASC paper, I placed the explosion point "B" (marked as B' on the map above) higher up at about 16 miles. In addition, according to my analysis above, the object would travel an additional 9-11 miles SE down-range from C/K's point "A" before exploding. This would place point B' at about 29-31 miles ground distance from downtown Detroit, and a total slant distance of about 34-36 miles away, exactly in agreement with that required for a 3 minute boom arrival time. This is the second, larger circle I've added to Chamberlain's graphic, showing all points around Detroit with a 3 min. delay time, with my alternate point B' lying on it. The 2.5 min figure Chamberlain gave in the S & T article could also be accommodated under this if the "Detroit area" he mentioned included Windsor, Ontario, parts of which are about 5 miles closer to point B'.
The total distance to the outer limits of "the Detroit area" on Chamberlain's map, e.g. Mt. Clemens, would be around 49-50 miles from point B', or about a 4.3 min. sound delay. While this still doesn't fully account for a 5 min "boom time", it is certainly a lot closer and probably well within margin of error for witness estimates of time.
It would further place the explosion point B' over the western part of Lake Erie, just south of land in Ontario, Canada (again, refer to diagram above, with revised explosion point B'). This would further help explain why no meteorite fragments were ever found on open, flat farming land in SW Ontario, where C/K's steep downward trajectory would place them, despite a "thorough search" by Canadian scientists, according to Chamberlain. (No meteorites from this event have been subsequently found in Ontario either, according to this meteorite database.)
(Another oddity in the Chamberlain's MoM graphic above is how the small town of Essex, Ontario, has been misplaced by about 3 mi., taking it out of the projected C/K JRASC trajectory path and meteorite fall--see graphic where correct position of Essex is marked. One might reasonably expect some small meteorites falling into or near town, where they might be more likely noticed than out in farming fields, another possible indication that the "exact" JRASC trajectory is wrong.)
The Elyria, OH, metal debris and possible NASA involvement
In contrast, it is easy to understand why meteorite fragments from an explosion over Lake Erie would not be found, being hidden in the lake. In addition, a trajectory over Lake Erie is at least consistent with a few witnesses at the time reporting that they thought they saw debris falling into the lake. And such a SE trajectory (presuming something survived the explosion and could remain airborne) could also take an object over Lorain and Elyria, Ohio, on the south side of Lake Erie (about 50-55 miles from the
explosion point--see map at top), where newspapers reported multiple grass fires presumed started by hot falling debris from the fireball, and actual metallic debris being recovered in Elyria.
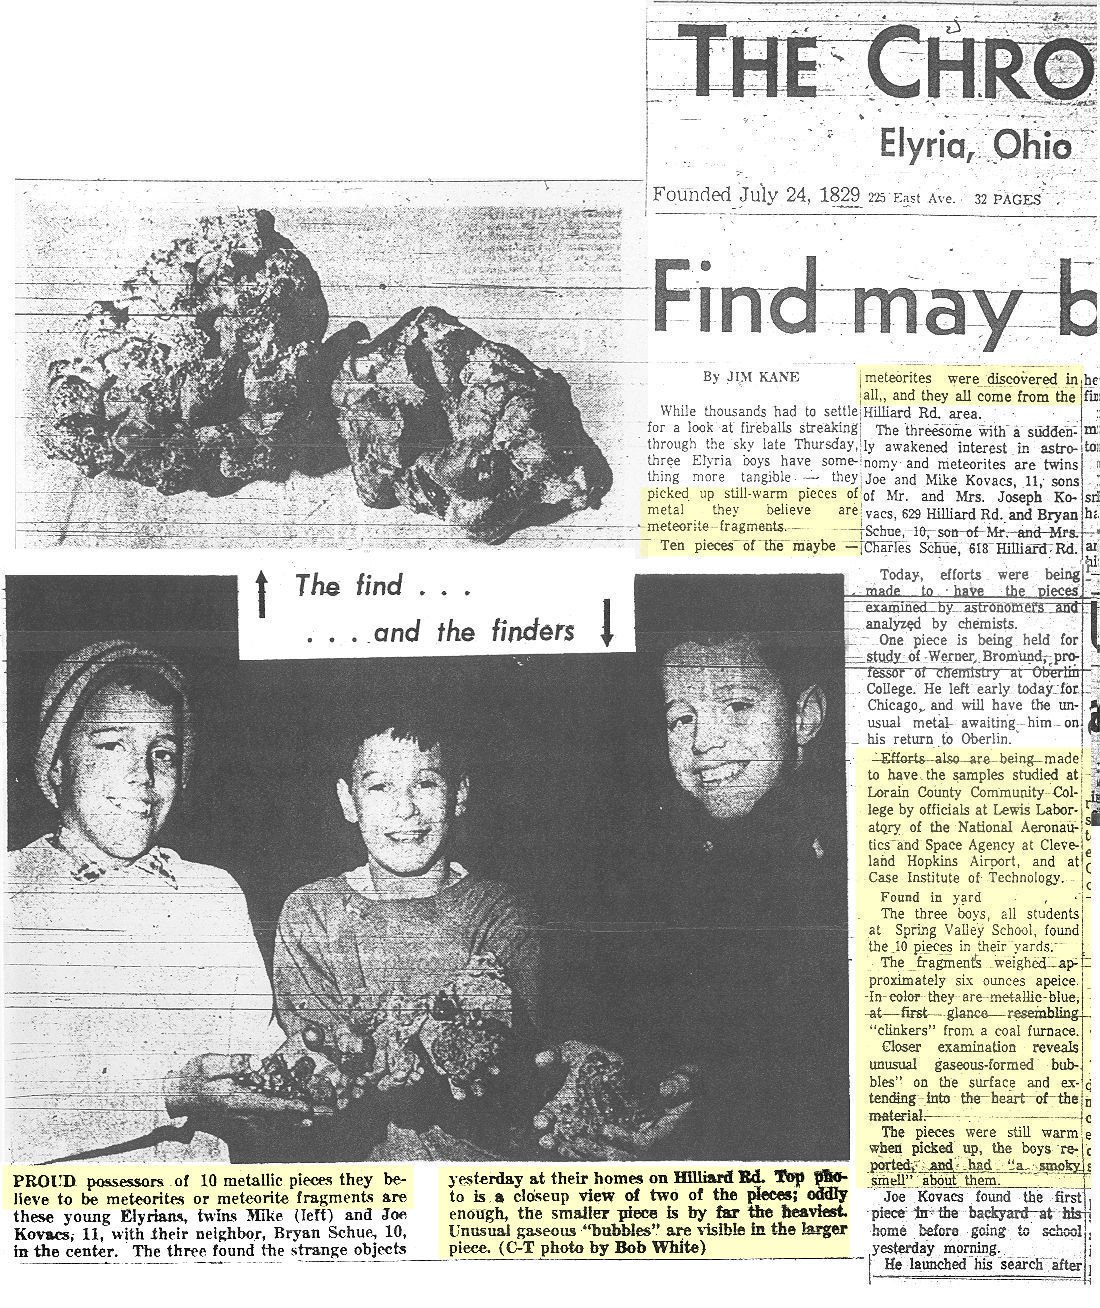
The Elyria newspaper reported the nearby NASA facility at Cleveland airport was interested in examining the debris. In 1995 I spoke to one of the now grown-up boys who recovered the fragments (see photo below). He told me the fireball flew directly over their heads and they saw the fragments as they fell down, being still warm to the touch when picked up. He also said 2 or 3 days later several white cars with NASA insignias came and picked up the fragments (which he described as crumbly and resembling iron slag from nearby steel mills he later worked in). The newspaper said there were 10 fragments in all, with a metallic-blue color, about 6 ounces each, with larger pieces having "unusual gaseous-formed bubbles on the surface, extending into the heart of the material." They had a smoky smell. (See highlighted text)
"Investigations of photographs and sightings of the fireball indicated its path through the
atmosphere was probably too steep to be consistent with a spacecraft re-entering from
Earth orbit and was more likely a meteor in a prograde orbit from the vicinity of the asteroid
belt, and probably ended its flight over western Lake Erie."
If that were the case, then why did NASA in 2005 claim they had examined actual debris from the fireball, but then lost it? Where exactly did they get the debris in the first place? C&K claimed no meteorites were found in southwestern Ontario, Canada, near Windsor/Detroit, where they projected the impact point. Was it the Elyria debris (or even Kecksburg) placing the explosion over western Lake Erie, not over land in southwestern Ontario? And the trajectory could not have been steep, but much shallower, as discussed above, and the surviving debris exiting the explosion would have had to travel about another 55 miles to reach Elyria, extremely unlikely, maybe impossible for a passive object like a meteor, considering the distance, low altitude, and measured speed at the end before the explosion. And why in the world would NASA put out a statement that it came from a "Russian satellite" in the first place when their analysts should have easily determined at the time it was meteorite debris?
SUMMARY
So in the end, we have a badly written "science" paper claiming to prove the widely seen fireball was a common meteor, only their own data likely demonstrated the opposite: the fireball was moving at hypersonic speeds when it exploded, but still probably too slowly to be a meteor. Seemingly the only way the authors could get a reasonable, low-end meteor speed was by shamelessly manipulating the data, ignoring the bulk of eyewitness testimony to a longer duration. The only directly calculable speed indicates a much lower observed apparent speed, and wasn't even presented in their paper. Using their own values for distance (7.4 mi) and proper consensus eyewitness agreement on duration given by the primary author on multiple occasions (4 sec, not 2 sec), the probable average speed on their perfect, error-free trajectory was only 20% of the value they seemingly guessed (6600 mph vs. 32,400 mph). This alone strongly suggests the fireball was an artificial object.Part II to the paper with the detailed eyewitness reports, including duration estimates, mysteriously disappeared, even though the authors claimed it fully backed up their meteor and trajectory conclusions.
And finally, just in time for the 40th anniversary of the Kecksburg event, NASA admitted to actually examining fragments, but from a Russian satellite, not a meteor, thus indeed an artificial object. Only the fragments and case files also mysteriously disappeared, so nothing can be proved. Further, their own orbital mechanics expert ruled out anything manmade coming out of orbit, Russian or US, could explain the fireball. More recently they changed their story to, "Oops, not a Russian satellite after all, must have been a meteor."
Since metal debris was reported recovered in Elyria, OH, and then possibly handed off to NASA, who publicly expressed interest, that could be what NASA later claimed they examined. If that was true, then the fireball trajectory was completely different than what the deeply flawed astronomy paper claimed, also suggested by the paper's lack of even basic error analysis. Proper error analysis would have shown a wide range of possible trajectories, including one over Elyria, on a basic course that could have reached Kecksburg, if
the object remained airborne. Also suggesting a fundamental error in trajectory is the contradiction between their explosion point and the reported time delays to hearing the explosion. Another inconsistency is the obvious thinning of the fireball trail, suggesting the object receding into the distance instead of their claim it moved sideways to the camera.
With all these serious contradictions and changes of story, you don't have to be into conspiracy theories or UFO crashes to realize none of this passes the smell test.
In Dec. 2005, during the 40th anniversary of the Kecksburg incident, a NASA spokesman stated that they had examined metallic fragments from the incident and allegedly determined they were from a Russian satellite that had broken up. However, NASA's own orbital mechanics expert told investigative journalist Leslie Kean that it was impossible for any satellite or missile at the time, Russian or ours, to account for the fireball and anything that might have been found at Kecksburg. NASA also claimed they had lost the debris and files during the 1990s, even after a lawsuit by Kean where the judge directed NASA to do a more diligent search. (Leslie Kean summary at UFOChronicles.com)
The Elyria, Ohio, metal debris allegedly recovered from fireball as it flew overhead. Local NASA facility may have picked up fragments. If debris came from fireball, this alone would disprove JRASC trajectory and indicate something artificial responsible. From Elyria Chronicle-Herald, Dec. 11, 1965, headline story.